Adding a New Report⚓︎
Adding a new report to PowerBI Portal
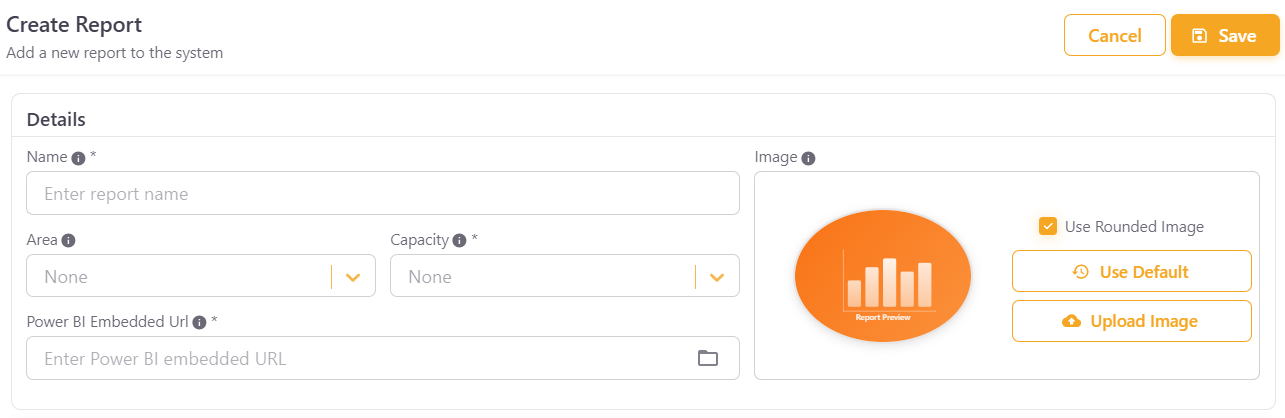
You can start adding new reports to PowerBI Portal by clicking Reports Management in the navigation menu to open the Reports List page and then clicking the Add Report button. There are three mandatory fields to fill when you add a report to PowerBI Portal: a unique Name of your choice, the report’s URL in Power BI Online, and the Power BI capacity used (previously configured).
The first optional field you’ll notice is Area. Reports sharing the same area name are grouped in PowerBI Portal’s Reports Viewer for ease of access.
When you add or edit a report, you can expand the Advanced Details panel on the right-hand side. It is organized into four tabs:
General⚓︎
This tab contains general metadata and display settings for the report:
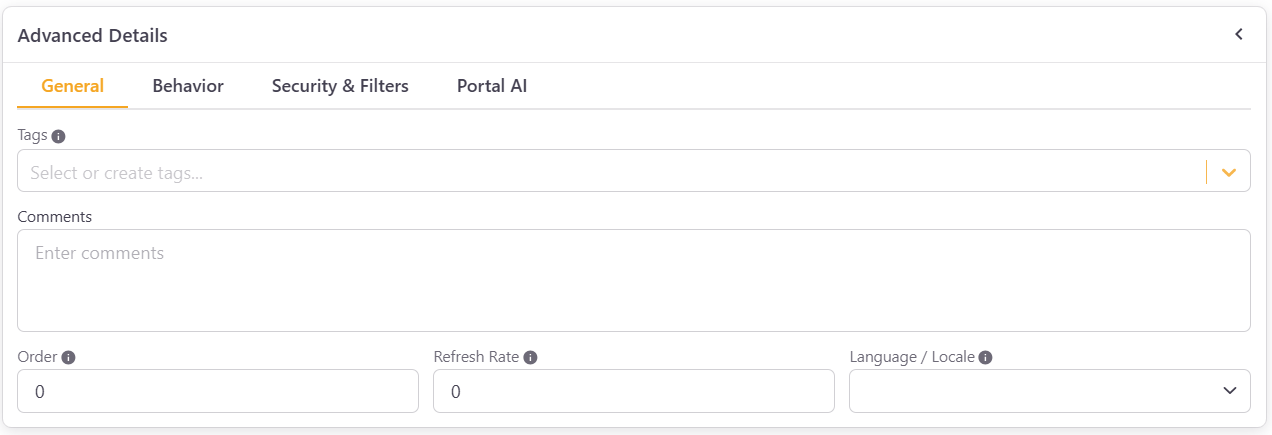
- Tags - Assign tags to help organize and filter reports.
- Comments - Add internal notes or comments about the report.
- Order - Set the order in which this report appears among other reports in the same Area.
- Refresh Rate - Define how frequently the report data should refresh.
- Language / Locale - Set the language or locale for the report display.
Behavior⚓︎
This tab controls how the report behaves and what elements are visible to users. It is divided into three sections:
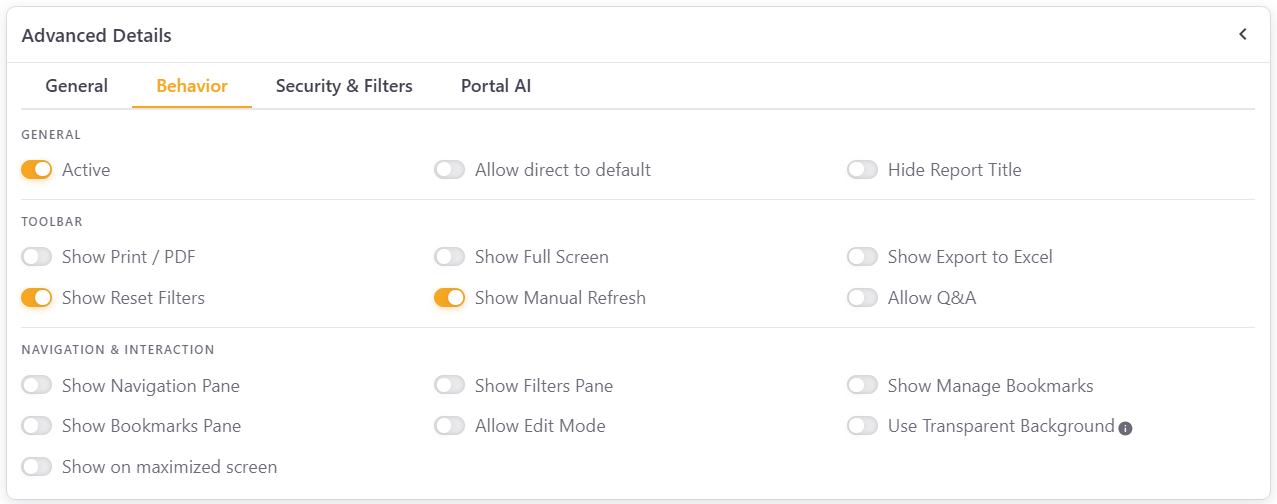
General
- Active - Toggle off to hide this report.
- Allow direct to default - Allow users to navigate directly to the default page of the report.
- Hide Report Title - Toggle on to hide the report title from users.
Toolbar
- Show Print / PDF - Show or hide the print and PDF export button.
- Show Full Screen - Show or hide the full screen button.
- Show Export to Excel - Show or hide the option to export report data to Excel.
- Show Reset Filters - Show or hide the reset filters button.
- Show Manual Refresh - Show or hide the manual refresh button.
- Allow Q&A - Enable or disable the Power BI Q&A feature for this report.
Navigation & Interaction
- Show Navigation Pane - Toggle the navigation menu (tabs) at the bottom of a Power BI report on or off. If you choose not to show it, the report displays the default page you set in Power BI.
- Show Filters Pane - Toggle Power BI filters side panel on or off.
- Show Manage Bookmarks - Show or hide the manage bookmarks option.
- Show Bookmarks Pane - Show or hide the bookmarks panel.
- Allow Edit Mode - Allow users to switch the report to edit mode.
- Use Transparent Background - Display the report with a transparent background.
- Show on maximized screen - Display the report maximized by default.
Security & Filters⚓︎
This tab controls row-level security, filters, and advanced query options:
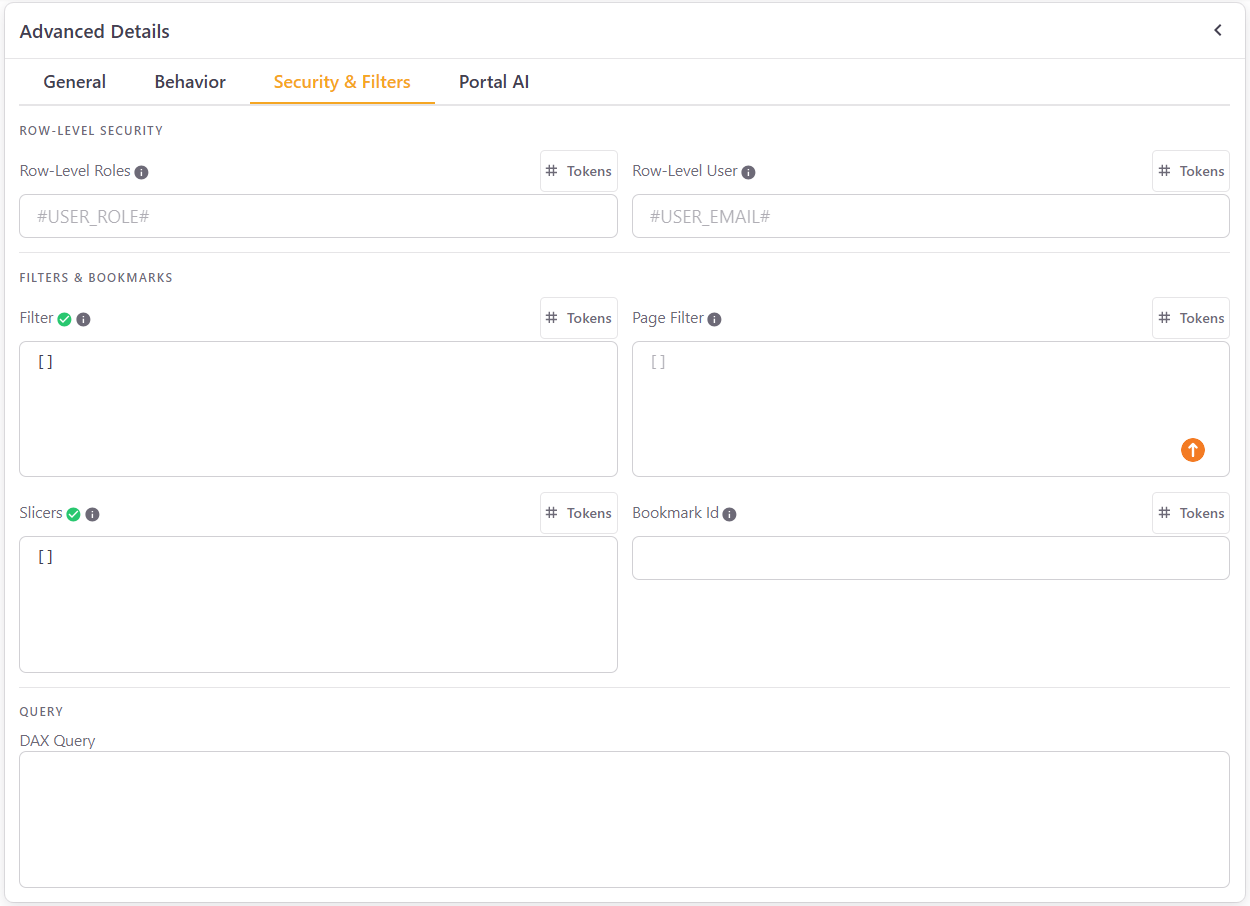
Row-Level Security
- Row-Level Roles - Roles are defined in Power BI Desktop to restrict data access. Enter the exact role name here. Use the
#USER_ROLE#token to dynamically apply the role based on the logged-in user. - Row-Level User - Enter the email of users you wish to restrict access to this report. Use the
#USER_EMAIL#token to dynamically apply this restriction to the logged-in user.
Filters & Bookmarks
- Filter - For advanced users with JSON knowledge. Paste a JSON filter to apply to the entire report.
- Page Filter - Similar to Filter, but applied at the page level. Accepts a JSON array of filter objects.
- Slicers - Define slicer values to apply when the report loads, in JSON format.
- Bookmark Id - Enter a bookmark ID to load the report with a specific bookmark state.
Query
- DAX Query - Enter a DAX query to be used in conjunction with the report.
Portal AI⚓︎
This tab allows you to enable AI-powered features for this report:
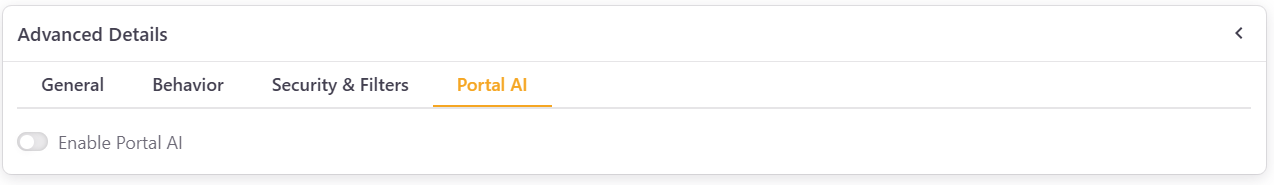
- Enable Portal AI - Toggle on to activate Portal AI for this report, allowing users to ask questions about the report data.
- Semantic Model Schema - Portal AI requires the semantic model schema to understand the report data structure and answer questions accurately. The Semantic Model ID is shown here, and you can click Get/Update Schema to retrieve or refresh it.
For a complete guide on setting up and using Portal AI, including environment configuration, permissions, and user access control, see the Portal AI documentation.
You can also click the report preview image to replace it with one of your choice. Once you are done, click Add Report and Save.