PowerBI Portal 101⚓︎
1. What is PowerBI Portal?⚓︎
PowerBI Portal is a web tool that allows organizations to embed any number of Power BI reports and dashboards on a web portal. Then, they can give access to that portal to any user, regardless of being in their organization or even having a Power BI account. Reports and dashboards on the PowerBI Portal retain full interactivity and can even be edited by any users with permission to do so.
PowerBI Portal also features an innovative cost optimization system that allows organizations to set an inactivity time after which Power BI Embedded’s capacity service is automatically turned off, instead of letting a workspace be perpetually available in the cloud. If activity is detected, the service is turned back on. This simple on-and-off switch results in tremendous savings in an organization’s Azure hosting costs, and the more reports it needs to share, the more it will save with PowerBI Portal.
2. Who should use PowerBI Portal?⚓︎
PowerBI Portal is a useful tool for organizations that:
- Share large amounts of reports and dashboards daily.
- Need to make part of their data available for clients or business partners.
- Must control how reports and dashboards are shared with people outside their organization.
- Want to lower the Azure hosting costs associated with their report-sharing activity.
3. Requirements for using PowerBI Portal⚓︎
Unlike our previous products, PowerBI Portal requires the subscription of additional Microsoft services, namely:
- At least 1 Power BI Pro license – some PowerBI Portal functionalities are unlocked by Power BI Pro, such as the ability to create App Workspaces, and peer-to-peer sharing.
- A Power BI Embedded subscription – Power BI Embedded is the engine powering the portal. Among other things, it’s what allows it to embed reports and dashboards, and set the timer for the capacity service that will reduce your organization’s Azure bill.
or
- Power BI Fabric
To learn more about what are the different capacities PowerBI Embedded visit: learn.microsoft.com/en-us/power-bi/developer/embedded/embedded-capacity#what-are-the-different-capacities
4. Setting up PowerBI Portal⚓︎
PowerBI Portal uses several services that must be enabled before using it. PowerBI Portal 101 won’t cover this one-time-only process because it’s already covered in 5 simple steps you can find in the Configuration Guide.
After completing the Power BI access configuration process, go to the Settings menu item to configure your organization’s PowerBI Portal. In the Settings section, you will find two important tabs:
-
Power BI Access
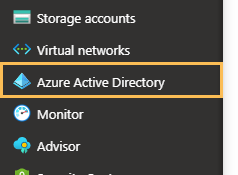
- In this tab, you need to provide your organization’s Tenant Authority—the ID of your Azure Active Directory tenant or a domain associated with it.
- If you created your own app during the PowerBI Portal access configuration, you must also enter your app’s Client ID and Client Secret so PowerBI Portal can access it.
-
Power BI Premium Capacities
- In this tab, enter the details available in your organization’s Azure Portal: the Subscription ID, Resource Group Name, and Dedicated Capacity.
These two tabs ensure that PowerBI Portal is properly connected to your organization’s Power BI and Azure resources.
Once again, if you decided to create your own app, you need to fill in your app’s Client ID and Client Secret in order to PowerBI Portal gain access to it. Finally, there’s a field to set your Power BI Embedded timeout, i.e., the number of minutes of no usage for PowerBI Portal to automatically pause the PowerBI Embedded Capacity Service. For example, if you set it to 20, at the end of 20 minutes of no usage, or slightly later, the Power BI Embedded service is automatically stopped to save resources. By default, it’s set to 0, meaning Power BI Embedded never stops to save resources, not even if PowerBI Portal isn’t being used.
Appearance – the third tab offers a wide range of options to personalize your organization’s portal layout and user experience:
- Primary Colour: Choose the main color for your portal’s interface.
- Portal Logo: Upload your organization’s logo or use the default image for the top bar.
- Welcome Message: Set a custom welcome message for users on the homepage.
- Message Size and Color: Adjust the size and color of the welcome message text.
- Background Image: Upload a custom background image or use the default one for the homepage.
These settings allow you to fully customize the look and feel of your PowerBI Portal, ensuring it aligns with your company’s identity.
Once you’re done, don’t forget to click the Save button on the bottom right corner to save all your settings.
5. Adding a new user to PowerBI Portal⚓︎
From the navigation menu, click Users to access the Users list menu. From here, you can manage the role of each user, what they have access to, and set their unique access code to PowerBI Portal. You can add new users to your organization’s registry either by individually adding them through the platform or importing them in bulk via Excel.
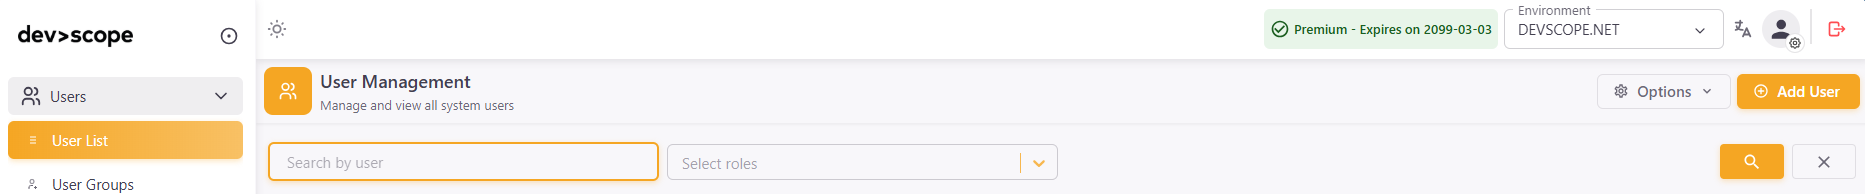
To individually add a new user through the platform, click Add New to open the following screen:
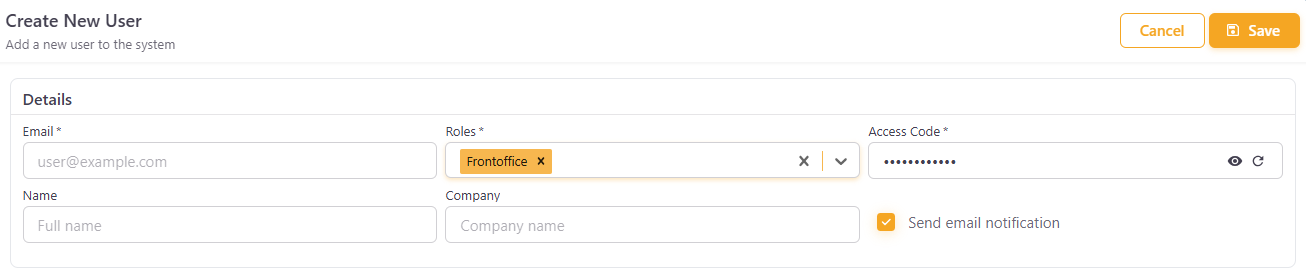
Insert your new user’s email, you must pick their role:
- Frontoffice – the user only has access to your organization’s PowerBI Portal’s frontoffice.
- Backoffice – the user can add new users with access to the front and backoffice, new reports, and manage the access list. They can access the frontoffice from the navigation menu.
- Master – has full access to PowerBI Portal, including the settings menu, and can add new users with the Master role.
Finally, you can either generate a random access code for your new user or create one with up to 20 characters. PowerBI Portal currently supports access via a Microsoft Account. If you add an email associated with a user’s Microsoft account, that user can access PowerBI Portal’s frontoffice by either using their unique access code or clicking the Sign in with Microsoft button.
Click the Add User button to add the new user to your list. You can repeat this process as many times as you wish. Click the Save button when you’re finished.
Alternatively, you can add new users in bulk via Excel. To do so, from the User list screen, click the Options button on the top right corner of the screen and select Import via Excel. This will open a modal where you can download the Excel template.

You’ll find 7 columns when you open the Excel template:
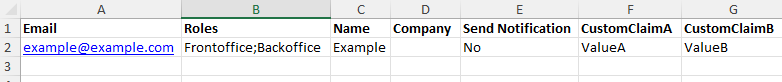
Fill in the Excel template by entering the required information for each user:
- Email: The user's email address.
- Roles: Assign one or more roles (e.g., Frontoffice;Backoffice), separated by semicolons if needed.
- Name: The user's display name.
- Company: The user's company name.
- Send Notification: Indicate whether to send a notification email (Yes/No).
- CustomClaimA, CustomClaimB, ...: (Optional) Add any custom claims as additional columns, with their corresponding values.
Once you have completed the template, return to PowerBI Portal, click Browse, select your filled Excel file, and press Upload. Finally, click Save to add the new users to your list.
All users added to PowerBI Portal are notified by email.
6. Adding a new report to PowerBI Portal⚓︎
You can start adding new reports to PowerBI Portal by clicking Reports Management in the navigation menu, and select the menu item Reports List to open the Reports List page and then clicking the Add Report button. There are only three mandatory fields to fill when you add a report to PowerBI Portal: a unique Name of your choice, the report’s URL in Power BI Online, and the Capacity.
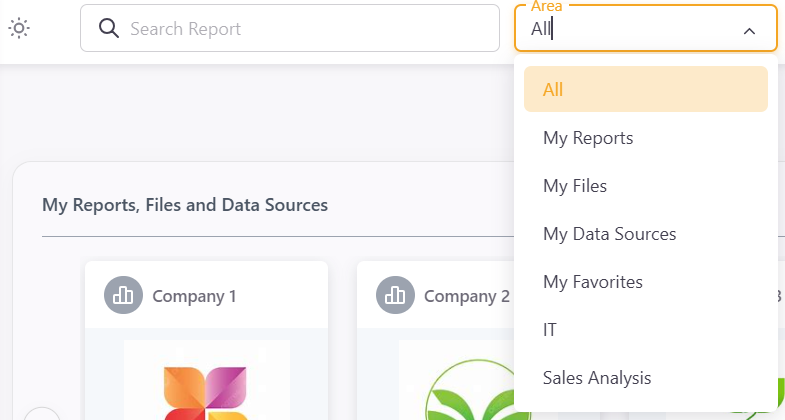
The first optional field you’ll notice is Area. Reports sharing the same area name are grouped in PowerBI Portal’s frontoffice for ease of access.
When you add or edit a report, you can expand the Advanced Details panel on the right-hand side. It is organized into four tabs:
General
This tab contains general metadata and display settings for the report:
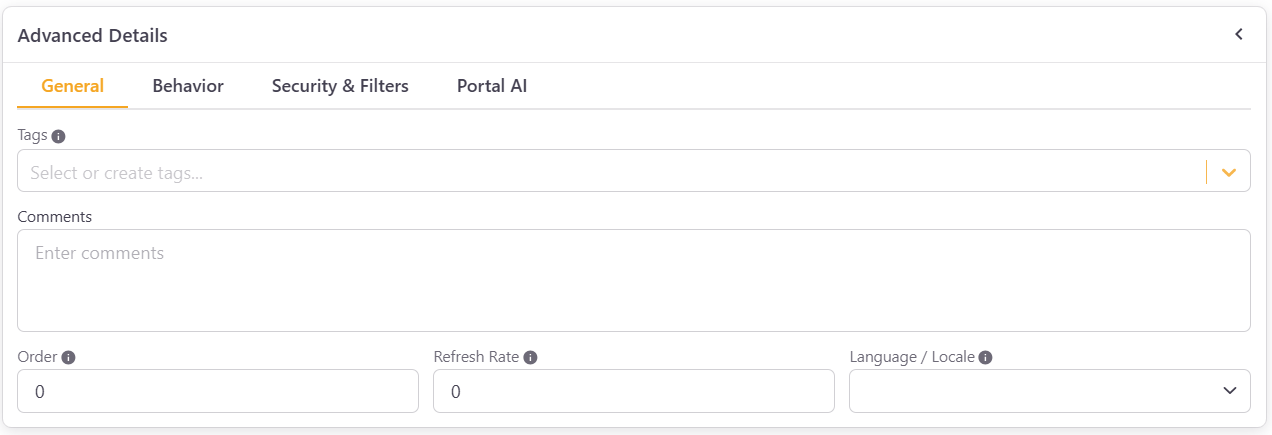
- Tags - Assign tags to help organize and filter reports.
- Comments - Add internal notes or comments about the report.
- Order - Set the order in which this report appears among other reports in the same Area in PowerBI Portal's frontoffice.
- Refresh Rate - Define how frequently the report data should refresh.
- Language / Locale - Set the language or locale for the report display.
Behavior
This tab controls how the report behaves and what elements are visible to frontoffice users. It is divided into three sections:
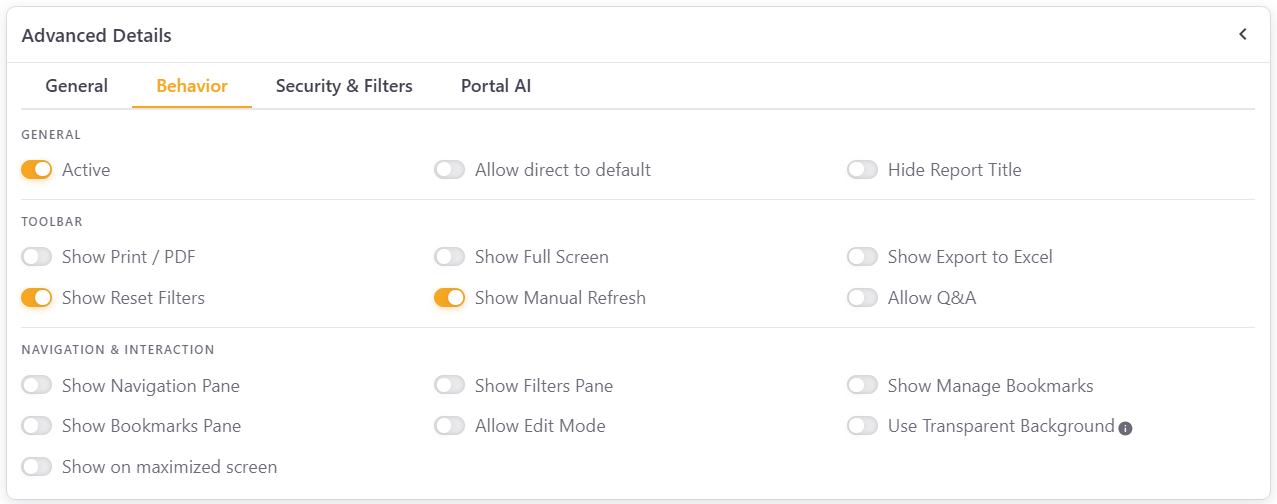
General
- Active - Toggle off to hide this report in the frontoffice.
- Allow direct to default - Allow users to navigate directly to the default page of the report.
- Hide Report Title - Toggle on to hide the report title from frontoffice users.
Toolbar
- Show Print / PDF - Show or hide the print and PDF export button.
- Show Full Screen - Show or hide the full screen button.
- Show Export to Excel - Show or hide the option to export report data to Excel.
- Show Reset Filters - Show or hide the reset filters button.
- Show Manual Refresh - Show or hide the manual refresh button.
- Allow Q&A - Enable or disable the Power BI Q&A feature for this report.
Navigation & Interaction
- Show Navigation Pane - Toggle the navigation menu (tabs) at the bottom of a Power BI report on or off. If you choose not to show it, the report in the frontoffice displays the default report you set in Power BI.
- Show Filters Pane - Toggle Power BI's filters side panel on or off.
- Show Manage Bookmarks - Show or hide the manage bookmarks option.
- Show Bookmarks Pane - Show or hide the bookmarks panel.
- Allow Edit Mode - Allow frontoffice users to switch the report to edit mode.
- Use Transparent Background - Display the report with a transparent background.
- Show on maximized screen - Display the report maximized by default.
Security & Filters
This tab controls row-level security, filters, and advanced query options:
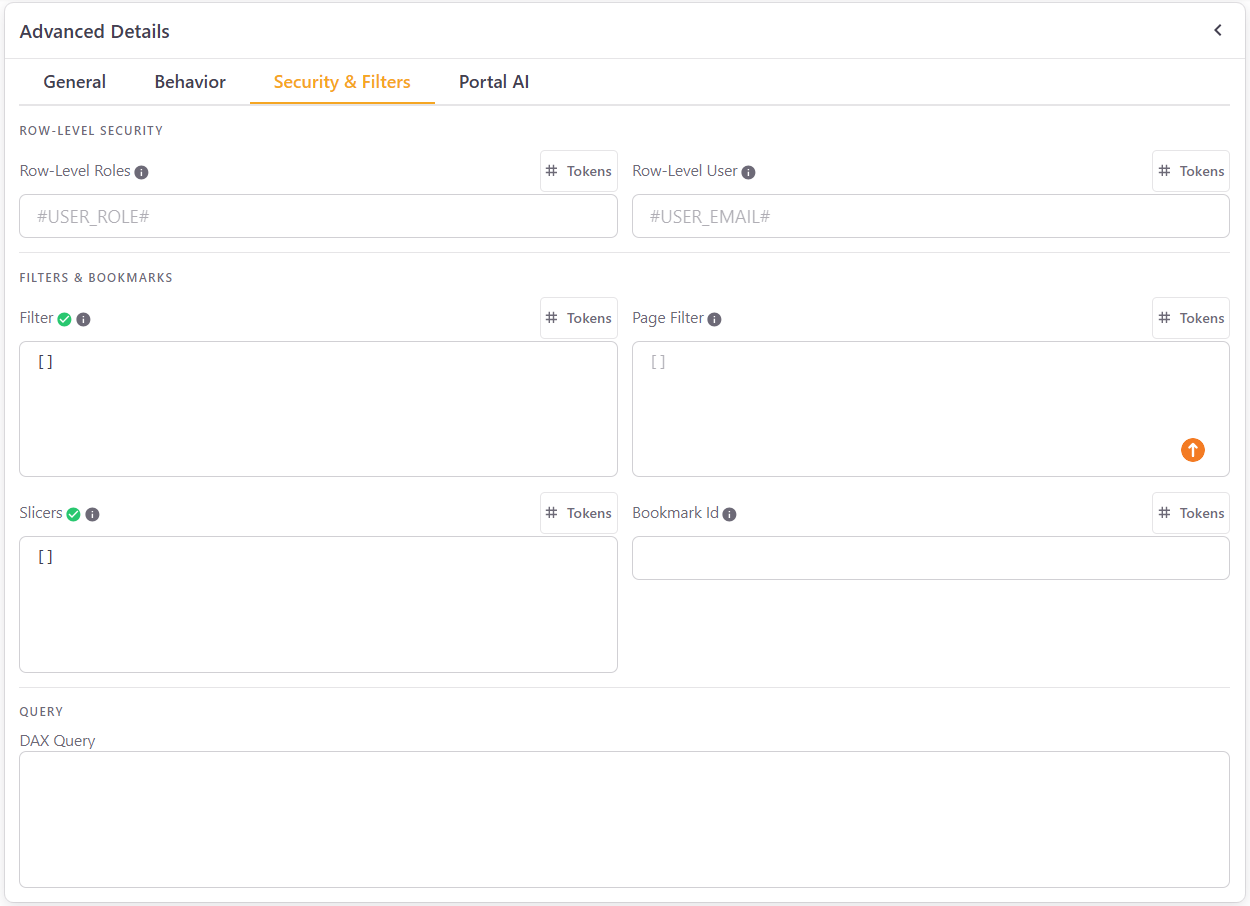
Row-Level Security
- Row-Level Roles - Roles are defined in Power BI Desktop to restrict access to some users. If you happen to use them in your organization and wish to restrict data access at the role level, enter the exact name of the role here. You can use the
#USER_ROLE#token to dynamically apply the role based on the logged-in user. - Row-Level User - Enter the email of users you wish to restrict access to this report. You can use the
#USER_EMAIL#token to dynamically apply this restriction to the logged-in user.
Filters & Bookmarks
- Filter - For advanced users with JSON knowledge. Paste a JSON filter to apply to the entire report.
- Page Filter - Similar to Filter, but applied at the page level. Accepts a JSON array of filter objects.
- Slicers - Define slicer values to apply when the report loads, in JSON format.
- Bookmark Id - Enter a bookmark ID to load the report with a specific bookmark state.
Query
- DAX Query - Enter a DAX query to be used in conjunction with the report.
Portal AI
This tab allows you to enable AI-powered features for this report:
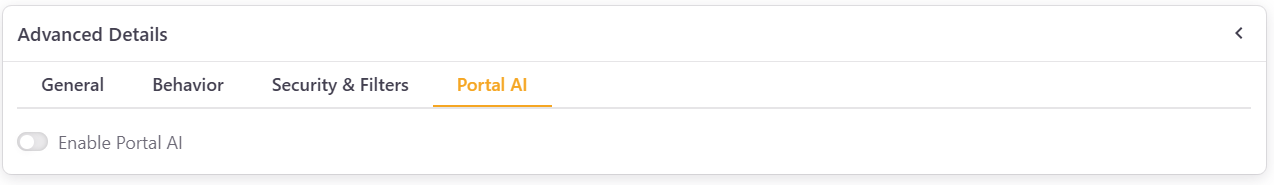
- Enable Portal AI - Toggle on to activate Portal AI for this report, allowing frontoffice users to ask questions about the report's data.
- Semantic Model Schema - Portal AI requires the semantic model schema to understand the report's data structure and answer questions accurately. The Semantic Model ID is shown here, and you can click Get/Update Schema to retrieve or refresh it.
For a complete guide on setting up and using Portal AI, see the Portal AI documentation.
Finally, you can click the report preview image to replace it with another of your choice. Once you're done, click Add Report and Save.
7. Associating a report to a user⚓︎
Now that you have your users and reports in PowerBI Portal, it’s time to associate one with the other. To get started, click Reports Management from the navigation button to go to the Access menu, and click Add Access to go to the next screen:
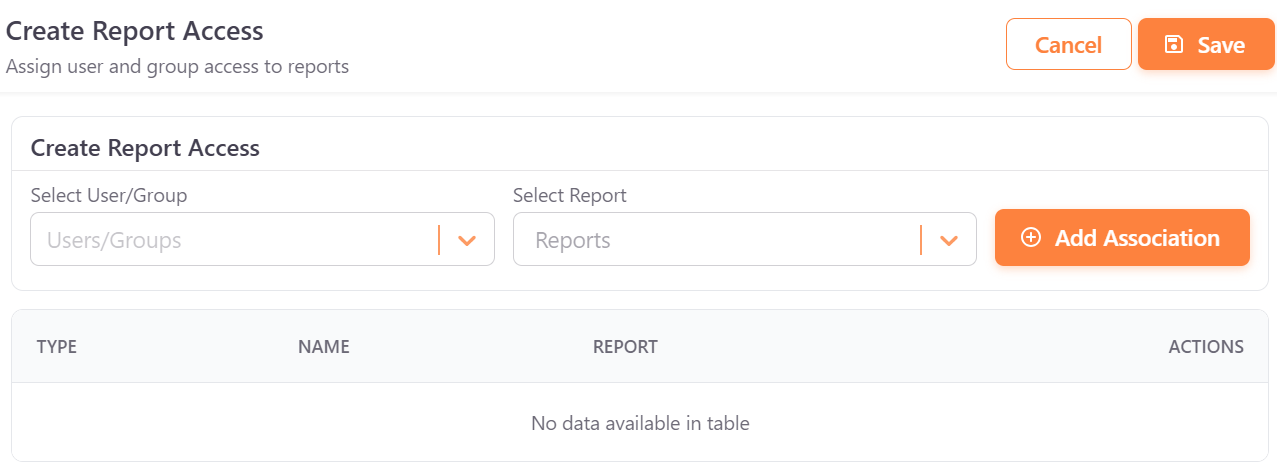
It’s really simple to pair a user with a report in PowerBI Portal. Just select the user or group of users from the first field, and the reports you wish to give them access to from the second field. PowerBI Portal offers tremendous flexibility when associating users to reports, so you can choose whether to give multiple people access to the same report or, instead, grant a single person access to several reports. After pairing a user with a report, click Add Association. You can keep associating as many users to reports as you wish. When you’re done, click Save.
8. Accessing Reports in PowerBI Portal⚓︎
To wrap up this PowerBI Portal 101, let's cover how users access their reports.
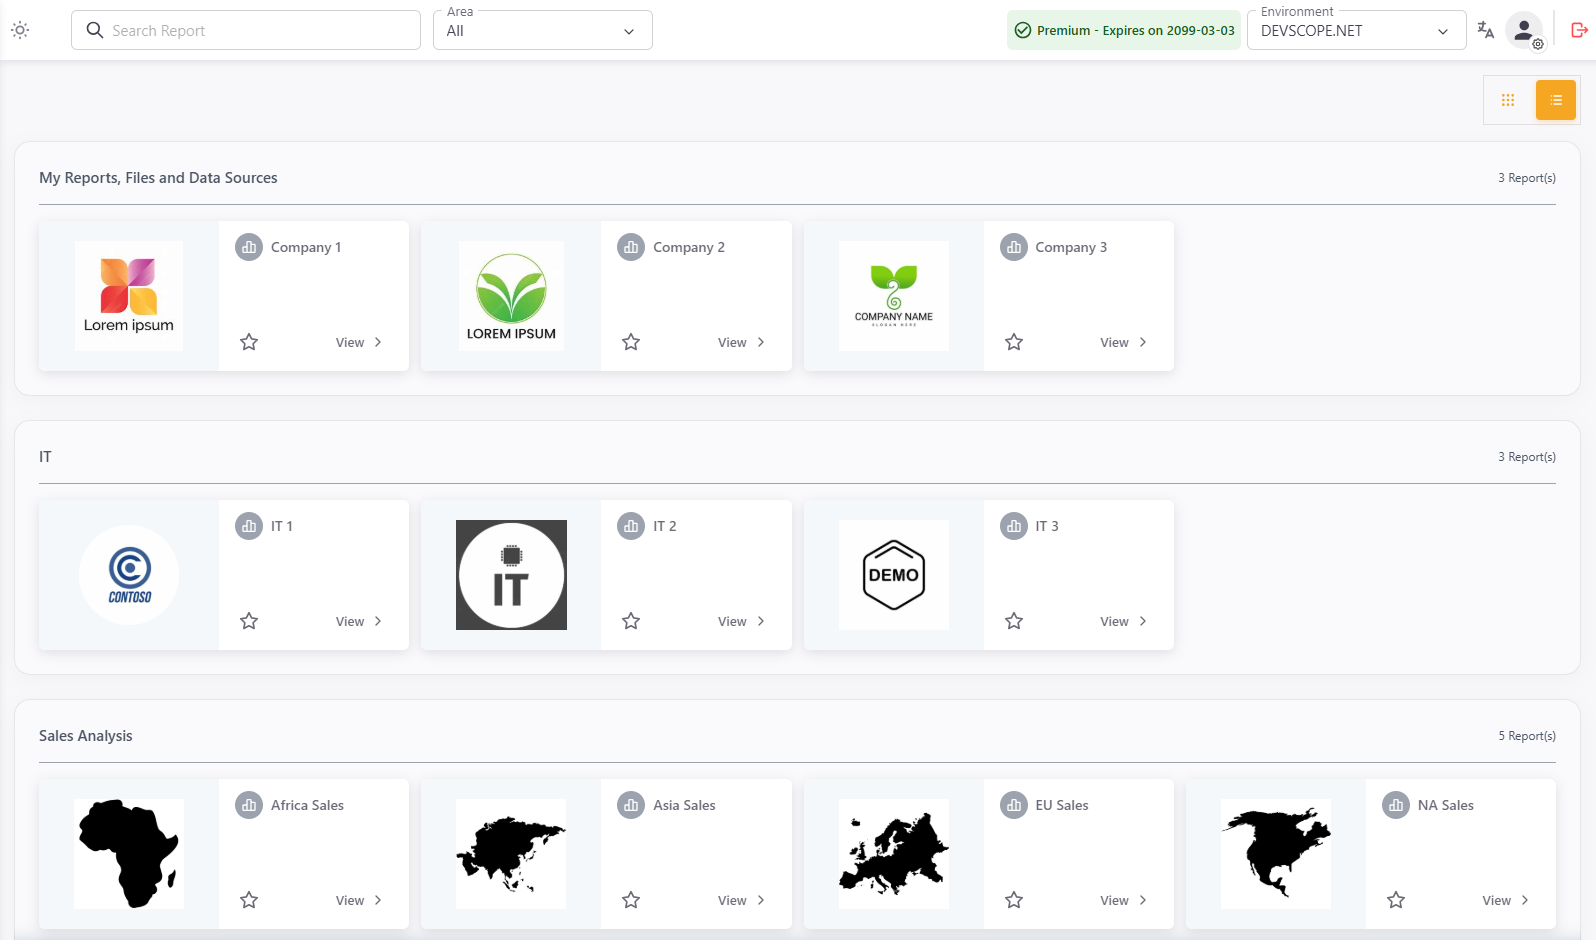
All users added to PowerBI Portal can have access to a place where the reports associated with them are available. They can access PowerBI Portal by either entering their unique access code or, alternatively, clicking the Sign in with Microsoft button if that account is associated with an email entered in PowerBI Portal. Access via Google will be introduced in the near future.
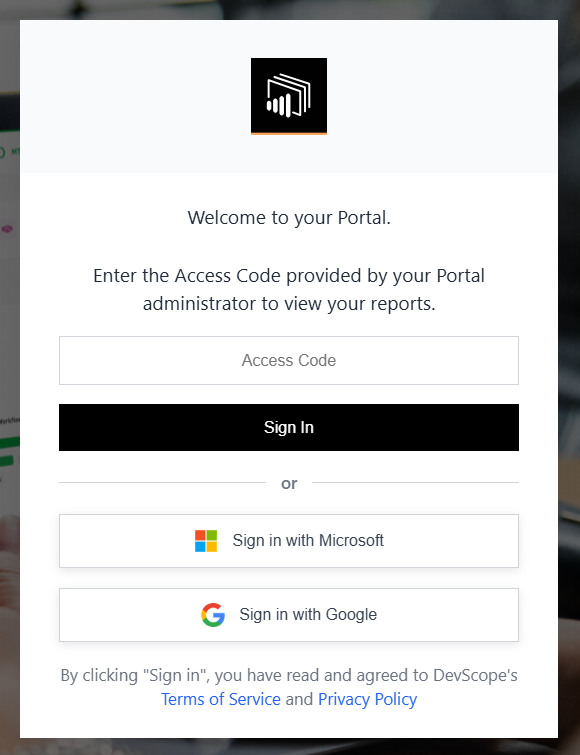
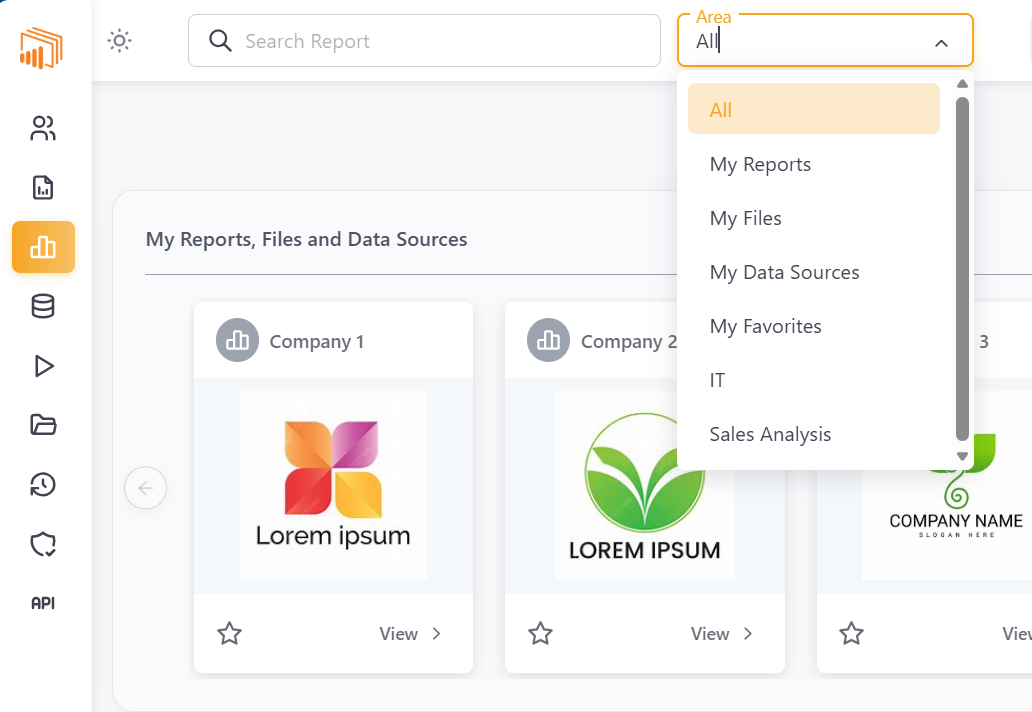
Once in PowerBI Portal, users have access to all reports associated with their account and can view or edit them according to their permissions. At the top left corner of the screen, users can switch between Areas if available.
Thank you for reading our PowerBI Portal 101, and using our product. If you still have any questions or run into some issues, feel free to contact our team at support@devscope.net.